
(**) Translated with www.DeepL.com/Translator
Update 2020-01-16 : This additional article allows the implementation of data storage in an InfluxDB database.
This procedure can easily be adapted to X86 and Amd64 environments (metal bars)…
I used Nagios a lot, then associated with Centreon, to monitor the infrastructures I had to manage. These are very heavy, resource-intensive solutions that freak you out when you need to apply the latest update…. The priority remained to have a lightweight solution. I preferred to take a step back and read a lot before choosing a solution for MytinyDC, I even thought about developing…
My research led to the website of PROMETHEUS, solution developed by the company SOUNDCLOUD and become open source.
By going to the site prometheus.io, I discovered a whole ecosystem and especially, programs compiled for ARM processors. The trail was serious.
From the first phase of tests, I quickly notice that the whole thing will be the solution: obvious simplicity of implementation, and above all a minimalist load for the small units I use.
This solution is often presented as a duo: Prometheus/Grafana . But what is Grafana???? As indicated on its Wikipedia page:
... allows the visualization and formatting of metric data...
https://fr.wikipedia.org/wiki/Grafana
Grafana is also available for ARM processors.
To summarize, it is necessary to install one or more programs exporting metrics, on the client servers (depending on the type of monitoring desired), a program on the server that collects the data, a program on the server to view the dashboards, and finally, the program on the server responsible for launching alerts. The result is very satisfactory:
 Prometheus/Grafana - Monitoring for MytinyDC
Prometheus installation
I will start by installing a metric exporter on a client server. The “Prometheus” project has a module “node_exporter” allowing the reading of system metrics (CPU load, networks, etc…) compiled for armv7 and arm64. After installation and start-up, it is very easy to check that it is working properly.
I will continue with the installation of the monitoring system itself, i.e. the service responsible for collecting metrics from client servers, called “Prometheus”.
It will then be necessary to install the “Grafana” server, which will allow to visualize the collected metrics, in the form of dashboards.
It is not finished, we will see the implementation of the alert system “Alertmanager”, without it, our monitoring system is useless.
And to close this post, we will see the installation of an additional exporter: “haproxy_exporter” for example and the integration of alerts in instant messaging systems:
- Matrix/Synapse/Element.io** (internal messaging from the French government)
- Rocketchat a competitor.
These two messaging systems are open-source and decentralized (your data is at home), of the same quality as Whatsapp, Hangout, Messenger. This makes them very serious competitors. Personally and after testing both, I prefer Matrix, which is very complete, robust, “ultra” fast, ergonomic, and supported by the small arm64 unit, which constitutes MytinyDC.
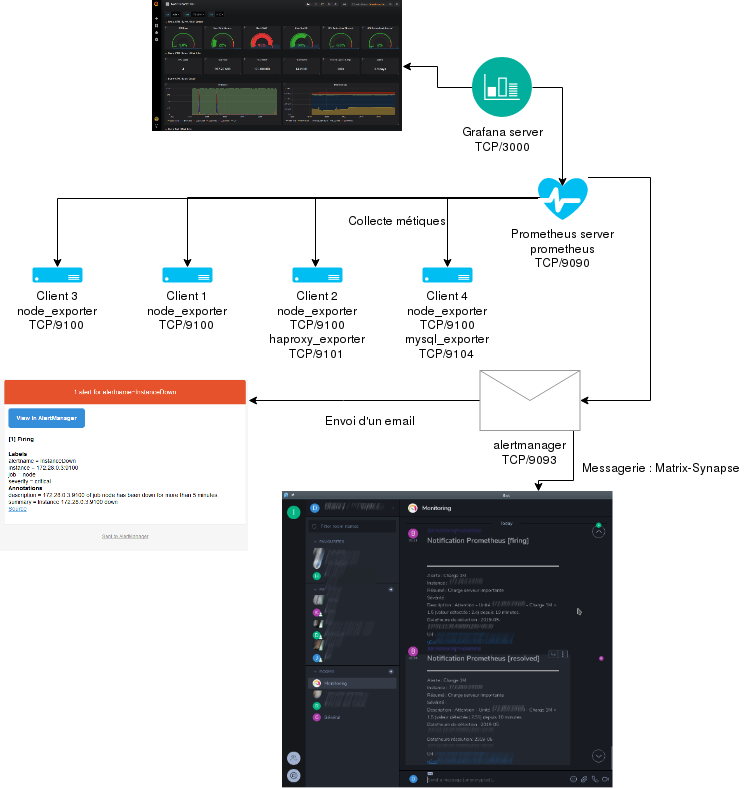 Topology Monitoring - MytinyDC
Downloads
- Prometheus : https://prometheus.io/download/
- Grafana : https://grafana.com/grafana/download?platform=arm
Prometheus-node_exporter installation on a client
Connect root to your client server, go to the /opt directory:
cd /opt
and download the archive “node_exporter “ corresponding to your platform :
- Rasberry PI: Operating system: Linux - Architecture: armv7
- Rock64 : Operating system : Linux - Architecture : arm64
Use the command wget, example for the Raspberry PI-0.17 version :
wget https://github.com/prometheus/node_exporter/releases/download/v0.17.0/node_exporter-0.17.0.linux-armv7.tar.gz
Extract the data from the archive, example for the previous download:
tar xfz node_exporter-0.17.0.linux-armv7.tar.tar.gz
rm node_exporter-0.17.0.linux-armv7.tar.gz
cd node_exporter-0.17.0.linux-armv7
# execute the export in detached mode
nohup./node_exporter &
The exporter is now working and listening on the port: TCP/9100
Let’s add the INPUT rules to the firewall of this server:
iptables -A INPUT -i eth0 -p tcp -m tcp --dport 9100 -j ACCEPT
iptables -A OUTPUT -o eth0 -p tcp -m tcp -m tcp --sport 9100 -m state --state RELATED,ESTABLISHED -j ACCEPT
To test the proper functioning of this service, use a browser with the url: http://[client server IP address]:9100/metrics
Impressive, without any particular configuration, the exporter already provides the server system information.
Prometheus server installation
Connect root to the server that will be responsible for collecting data from the different clients, go to the /opt directory:
cd /opt
and download the archive ** “Prometheus “** corresponding to your platform:
- Rasberry PI: Operating system: Linux - Architecture: armv7
- Rock64 : Operating system : Linux - Architecture : arm64
Use the command wget, example for the Raspberry PI-0.17 version :
wget https://github.com/prometheus/prometheus/releases/download/v2.6.0/prometheus-2.6.0.linux-armv7.tar.gz
Extract the data from the archive, example for the previous download:
tar xfz prometheus-2.6.0.linux-armv7.tar.tar.gz
rm prometheus-2.6.6.0.linux-armv7.tar.gz
cd prometheus-2.6.6.0.linux-armv7/
Collector configuration - yaml file
I will present here a basic configuration file, in case I have a Prometheus server (IP 172.28.0.3) and a client (IP 172.28.0.4)
global:# Default is every 1 minute.
   scrape_configs:
  # server prometheus listens on TCP/9090
  - job_name:'prometheus'.
         #metrics_path defaults to "/metrics
         #scheme defaults to "http".
      static_configs:
        - targets: ['localhost:9090']

  # Exporters: client servers
  - job_name:'nodes'.
     scrape_interval: 1m # Override the default global interval for this job
     scrape_timeout: 10s # Override the default global timeout for this job
     static_configs:
     - targets: [' 172.28.0.0.4:9100']
Adapt this configuration to your situation, the client in my case is represented by the IP address: 172.28.0.4_
Start the collector in detached mode:
nohup./prometheus &
The collector is working and is now listening on the port: TCP/9090
Let’s add the rules INPUT to the firewall of this server so that it accepts connections on the port TCP/9090 :
iptables -A INPUT -i eth0 -p tcp -m tcp --dport 9090 -j ACCEPT
iptables -A OUTPUT -o eth0 -p tcp -m tcp -m tcp --sport 9090 -m state --state RELATED,ESTABLISHED -j ACCEPT
It is a collector, which implies that it will connect to the TCP/9100 port of the client server(s), as indicated in the Prometheus server configuration, let’s also add the OUTPUT rules:
iptables -A OUTPUT -o eth0 -p tcp -m tcp --dport 9101 -j ACCEPT
iptables -A INPUT -i eth0 -p tcp -m tcp -m tcp --sport 9101 -m state --state RELATED,ESTABLISHED -j ACCEPT
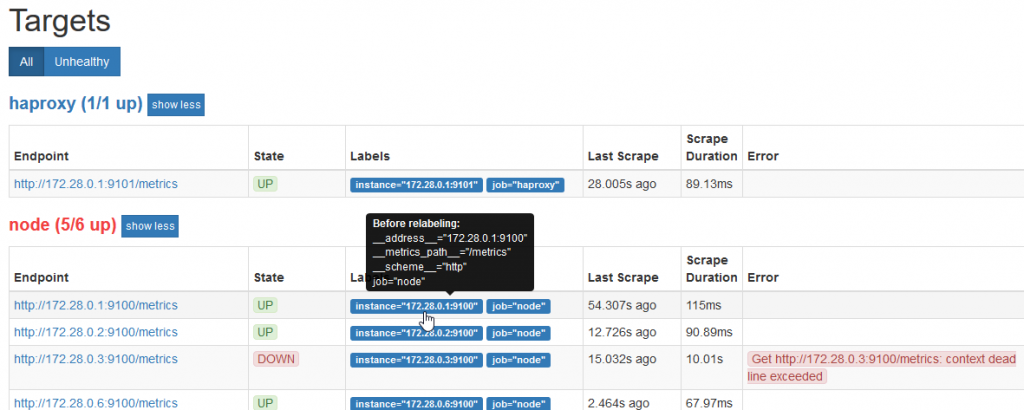
To test the proper functioning of this service, use a browser with the url: http://[IP address of prometheus server]:9090/targets
which allows you to view the list of exporters registered in the monitoring process:
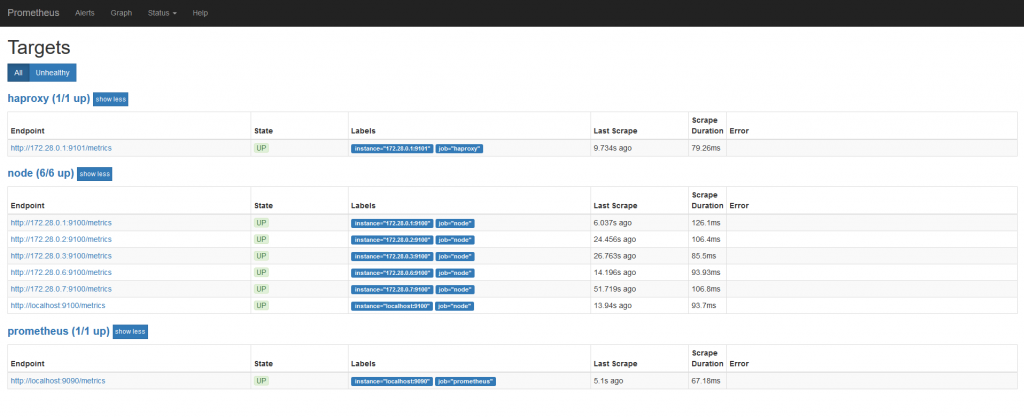
In my case, we see 6 servers registered in the “node” job responsible for collecting system information, the “Prometheus” job which is the monitoring server, and the “haproxy” responsible for collecting the metrics of a loadbalancer.
At this point, you can already view the data collected using Prometheus’ internal viewer:
http://[IP address of prometheus server]:9090/graph
This minimalist device does not allow you to build dashboards, but only to display an ephemeral graph.
In less than 20 minutes, the collection system is in place and operational
Reload the Prometheus server configuration
You have the option of restarting the server using the kill command and running the program again, or reloading the configuration, sending the HUP signal to the process. Another option per API call exists but you will have to start Prometheus with the parameter “–web.enable-lifecycle”, not recommended in the documentation and make the call with the command curl :
curl -X POST http://[address of the prometheus server]:9090/--/reload
The prescribed method is to send the HUP signal to the process
ps -ef | grep prometheus - recover the pid
kill -HUP[pid process prometheus]
Grafana installation
Refer to the topology above, the Grafana server will retrieve the metrics from the Prometheus server, in order to display them in its interface.
Server installation
Connect root to the server that will be in charge of Grafana support, go to the /opt directory:
cd /opt
and download the archive “Grafana “ corresponding to your platform (link above):
- Rasberry PI: Ubuntu & Debian (ARMv7)
- Rock64: Ubuntu & Debian(ARM64)
Use the command wget, example for the Raspberry version :
wget https://dl.grafana.com/oss/release/grafana_5.4.2_armhf.deb
Install this Debian package with the command “dpkg”:
dpkg -i grafana_5.4.2_armhf.deb
If this command asks you to install dependent software, immediately use the command :
apt -f install
Remove the package
rm grafana_5.4.2_armhf.deb
The installation program will give you instructions for final setup and start-up.
After starting the Grafana server listens on the port TCP/3000
Let’s add the INPUT rules to the firewall of this server:
iptables -A INPUT -i eth0 -p tcp -m tcp --dport 3000 -j ACCEPT
iptables -A OUTPUT -o eth0 -p tcp -m tcp -m tcp --sport 3000 -m state --state RELATED,ESTABLISHED -j ACCEPT
Parameter setting
Using a browser, connect to the Grafana server: http://[Grafana server IP address]:3000
The account and password are: admin/admin
**Grafana will ask you to change this password.
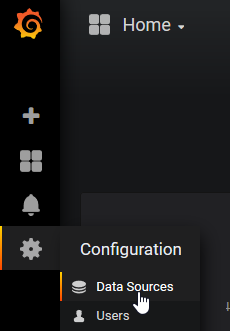
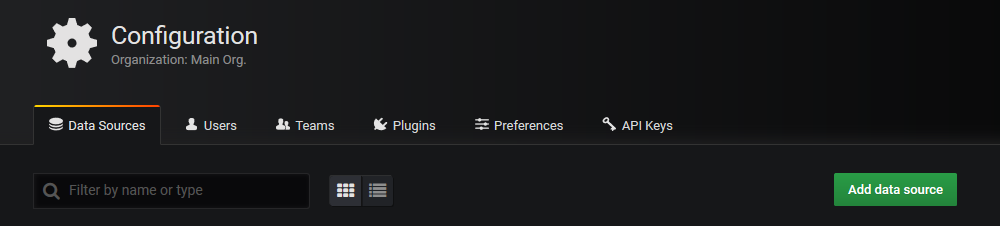
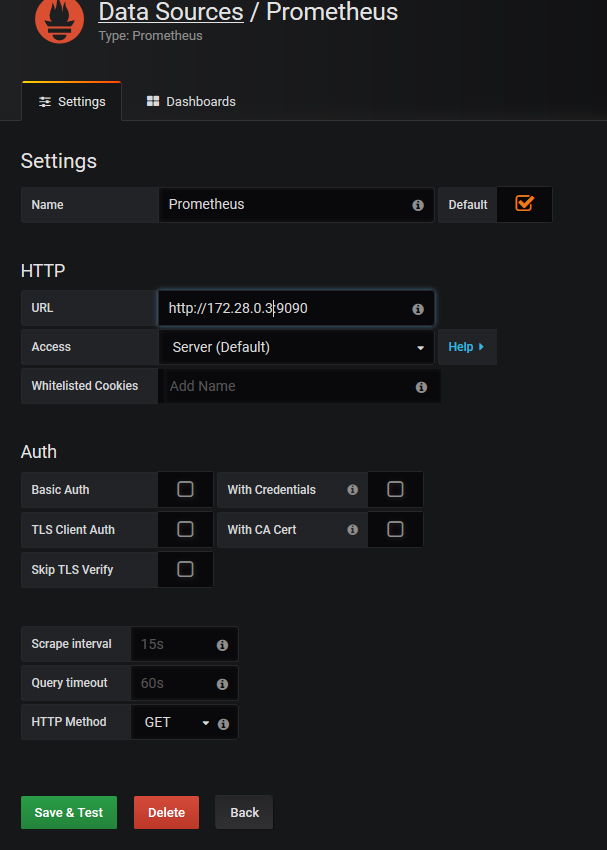
The first configuration to be made will be to create the data source, which will be the server **Prometheus**
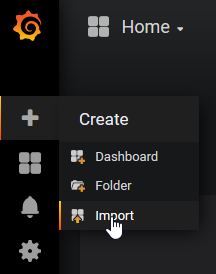
The data is now available, we will be able to implement a dashboard. Or at least, to start with, import an existing dashboard. Indeed, the dashboards created can easily be exported and reused by others. Prometheus, always returns the same data schema, therefore, the dashboards are distributable. To start, I advise you to import the dashboard with the ID: 1860 (https://grafana.com/dashboards/1860)
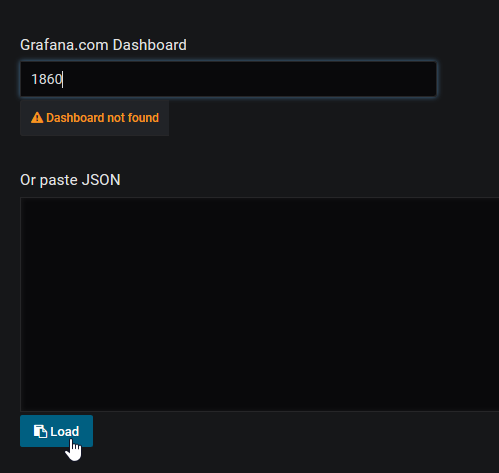 Specify the dashboard id and click on load *
 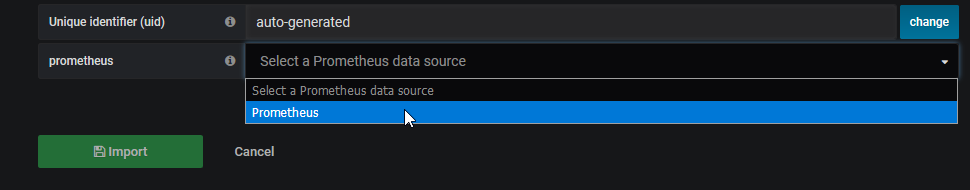 Select the data source
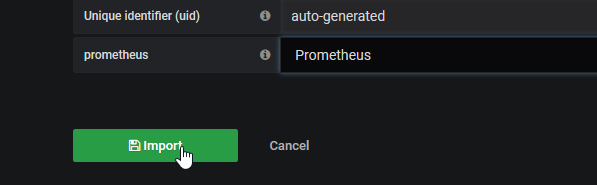
Click on import
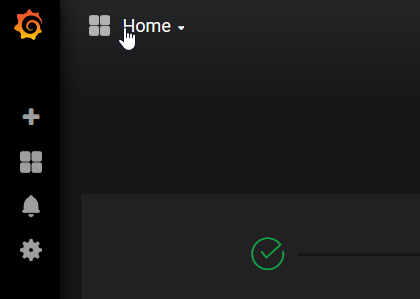
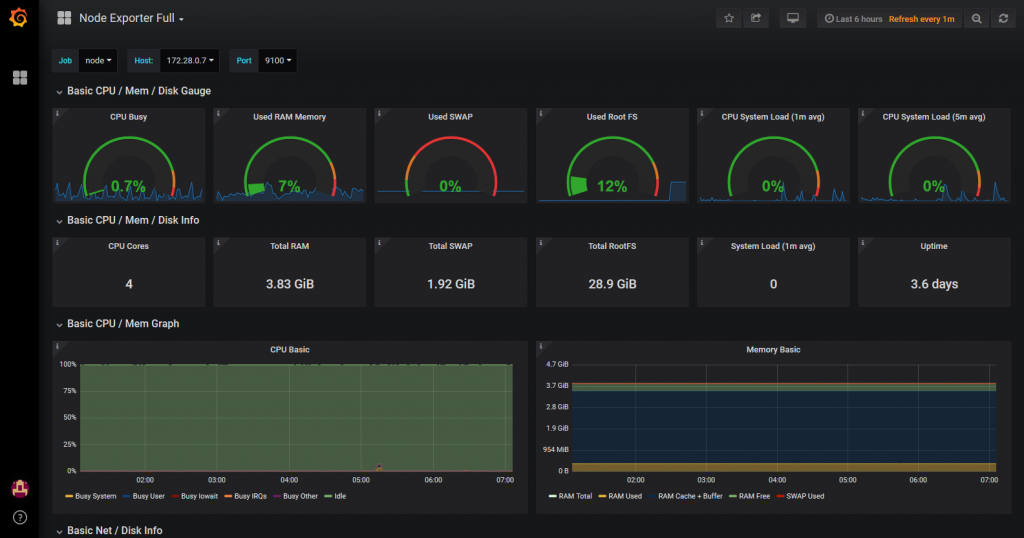
Click on the dashboad selector and select Node Exporter Full
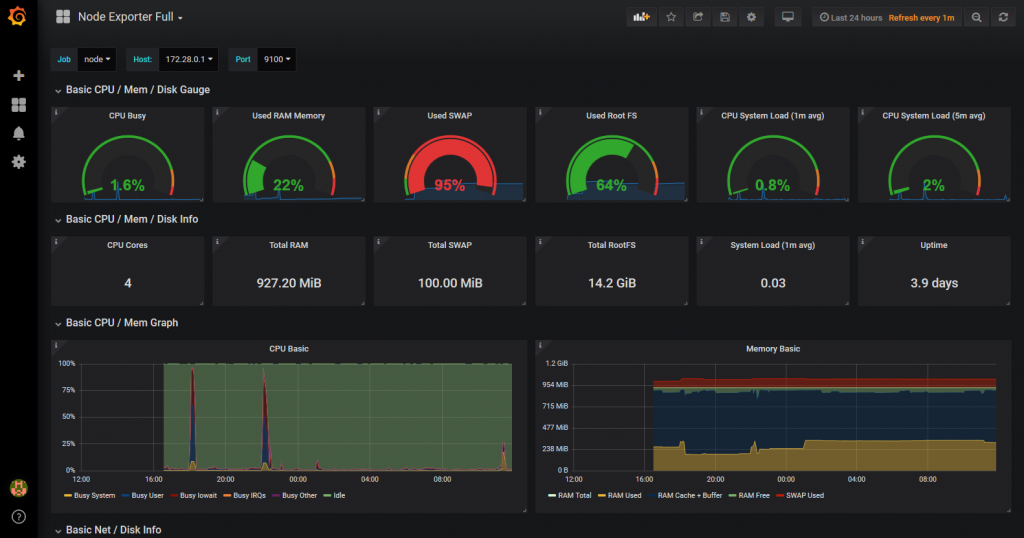
The result is immediate
Add a customer to the monitoring system
I want to add server 172.28.0.2 to the monitoring, follow the procedure above to install the exporter. Let’s add the server in the server configuration (job : nodes) :
global:# Default is every 1 minute.
scrape_configs:
# server prometheus listens on TCP/9090
- job_name:'prometheus'.
#metrics_path defaults to "/metrics
#scheme defaults to "http".
static_configs:
- targets: ['localhost:9090']
# Exporters: client servers
- job_name:'nodes'.
scrape_interval: 1m # Override the default global interval for this job
scrape_timeout: 10s # Override the default global timeout for this job
static_configs:
- targets: [' 172.28.0.0.4:9100']

   - targets: [' 172.28.0.0.2:9100']
Adapt the bold elements to your situation.
Reload the Prometheus configuration (see above)
Alerts
Prometheus has several connectors (alert distribution channels), various pagers, incident management tools and the email we will discuss here.
Alert server installation
The architecture is “decentralized”, this service can be placed on a different server from the Prometheus monitoring server.
Connect root to your alert server, go to the /opt directory:
cd /opt
And download the archive ** “alertmanager “** corresponding to your platform :
- Rasberry PI: Operating system: Linux - Architecture: armv7
- Rock64 : Operating system : Linux - Architecture : arm64
Use the command wget, example for the Raspberry PI-0.16 version :
wget https://github.com/prometheus/alertmanager/releases/download/v0.16.0-alpha.0/alertmanager-0.16.0-alpha.0.linux-armv7.tar.gz
Extract the data from the archive, example for the previous download:
tar xfz alertmanager-0.16.0-alpha.0.linux-armv7.tar.gz
rm alertmanager-0.16.0-alpha.0.linux-armv7.tar.gz
cd alertmanager-0.16.0-alpha.0.linux-armv7/
Parameter setting
The server configuration is done by means of a file in yaml format: alertmanager.yml. The prerequisite is a functional messaging system. My stmp configuration: localhost, without authentication.
global:
 templates:
 - "./templates/*.tmpl"
road:
group_by: ['alertname']
group_wait: 30s
group_interval: 5m
repeat_interval: 5h
receiver: "email" # A default receiver
roads:
  - game:
severity:'warning'.
receiver: "email
  - game:
  severity: critical
receiver: "email
receivers:
  - name: "email

 email_configs:

  - send_resolved: true
to: '[email destination]''
smarthost:'localhost:25'.
from: '[sender email]'
headers:
From: '[sender email] '
Subject: {{{template "email.default.subject" . }}'
To: [email destination]
html: `{{{template "email.default.html" . }}'
require_tls: false
Adjust this configuration according to your situation (in bold and between[])_
Run alertmanager in detached mode:
nohup./alertmanager &
The altertmanager works and now listens on the port: TCP/9093
Let’s add the INPUT rules to the firewall of this server:
iptables -A INPUT -i eth0 -p tcp -m tcp --dport 9093 -j ACCEPT
iptables -A OUTPUT -o eth0 -p tcp -m tcp -m tcp --sport 9093 -m state --state RELATED,ESTABLISHED -j ACCEPT
To test the proper functioning of this service, use a browser with the url: http://[client server IP address]:9093
 Alertmanager in operation
Prometheus server settings
Go to the Prometheus server directory and add to the prometheus.yml file:
alerting:
  alert managers:
    - static_configs:
       - targets:
           - "Localhost:9093
rule_files:
 - "./rules.yml"
Adapt the bold elements to your situation
Create the file rules.yml in the Prometheus directory :
groups:
- name: example
rules:
- alert: InstanceDown
expr: up == 0
for: 5m
labels:
severity: critical
annotations:
summary: "Instance {{$labels.instance }} down"
description: "{{$labels.instance }} of job {{ $labels.job }} has been down for more than 5 minutes."
Reload the Prometheus configuration (see above)
If the Alertmanager service is not hosted on the Prometheus server, add the Firewall rules on the Prometheus server:
iptables -A OUTPUT -o eth0 -p tcp -m tcp --dport 9093 -j ACCEPT
iptables -A INPUT -i eth0 -p tcp -m tcp -m tcp --sport 9093 -m state --state RELATED,ESTABLISHED -j ACCEPT
Generation of an alert
The easiest way to do this is to deny access to port 9100 of a client server by removing the corresponding firewall rule, or simply stop the node_exporter process on the server.
Prometheus will consider it as: “down”.
Alert message flow
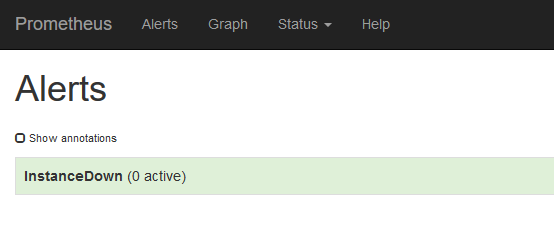
First connect to the web interface of the prometheus server, menu “Alerts”. No alerts at the moment
We are waiting for the next “scrapping” to this server (web interface of the prometheus server, “Status/Targets” menu)
Switch to the “Alerts” menu
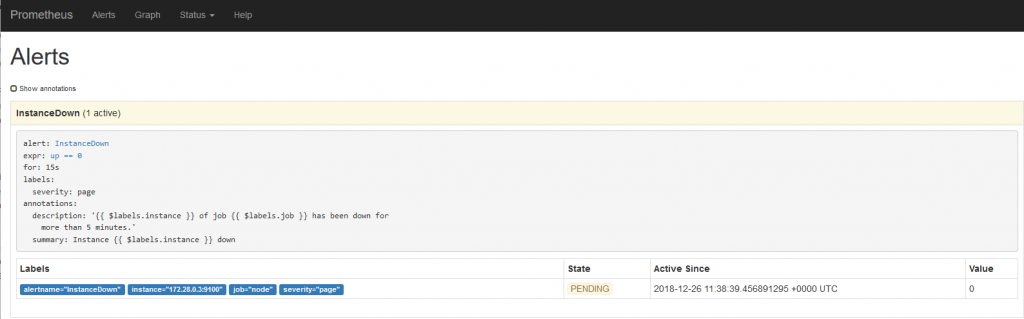 The alert is on standby
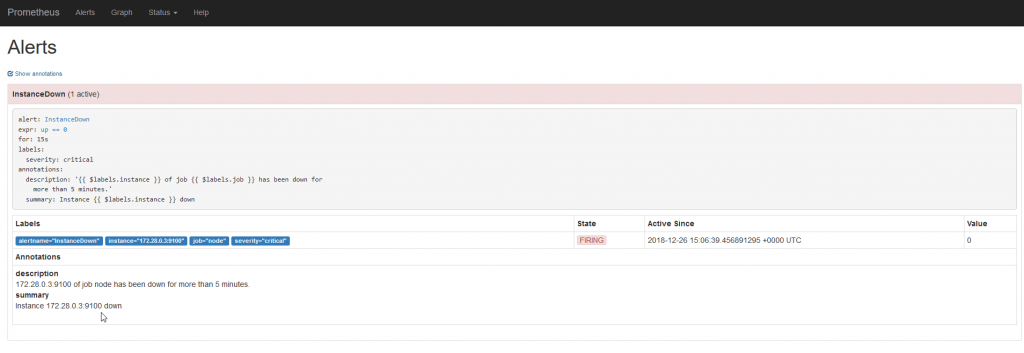 The alert is triggered, so sent to the manager’s alertmanager
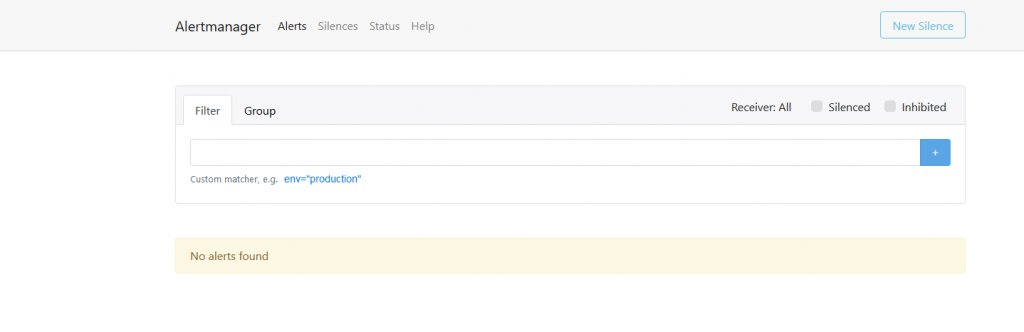
Connect to the web interface of the alertmanager
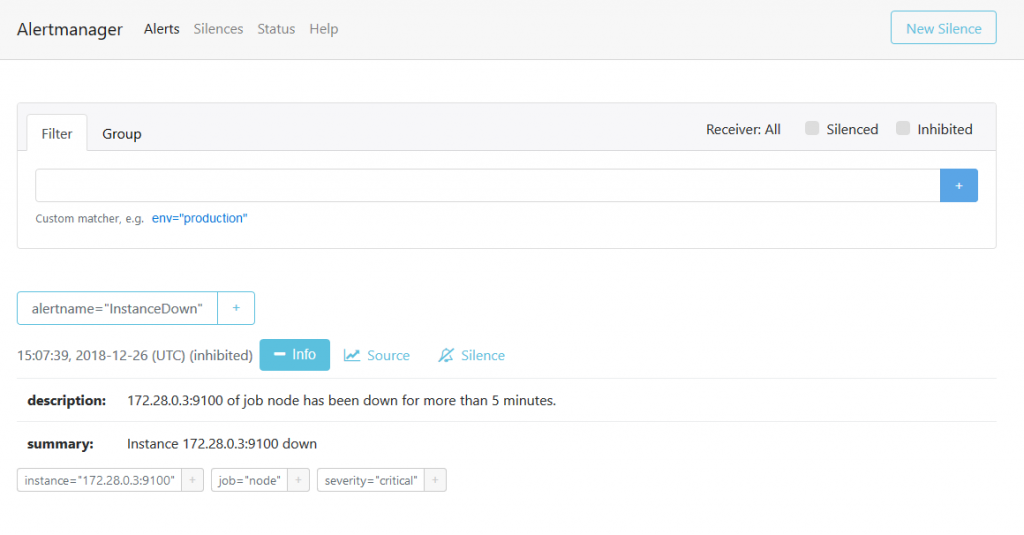
The alert is published
The alert email has been sent, check your mailbox.
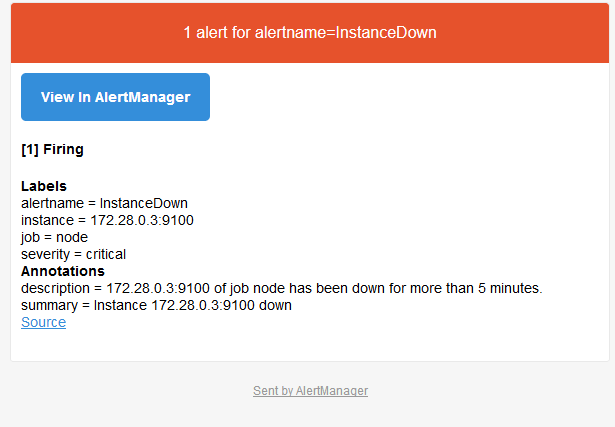 Content of the alert email
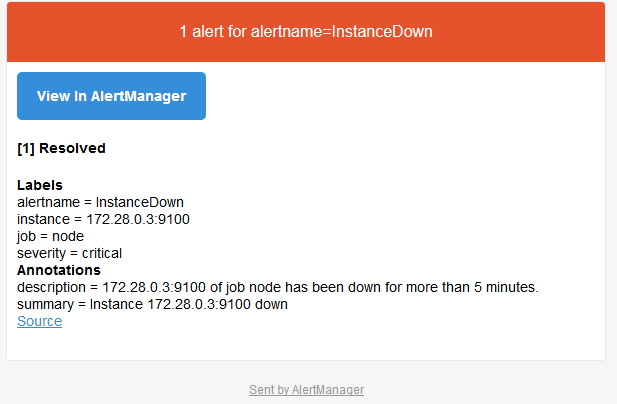
**Our system is operational.
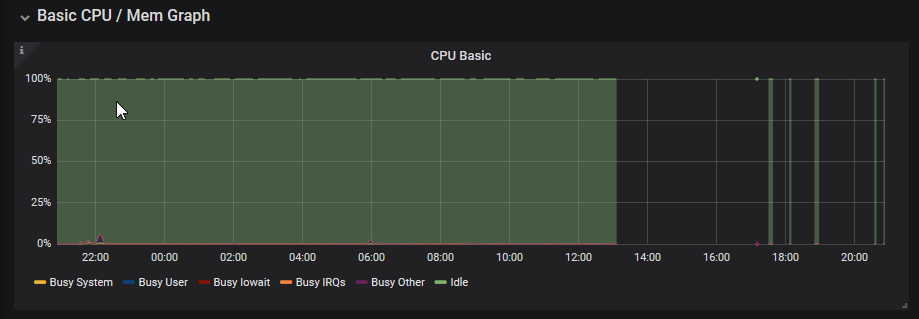
Add the firewall rules for accessing the TCP/9100 port on the failed unit, or restart the node_exporter process. And wait for the next “scrapping”. An email is sent, indicating the disappearance of the defect:
This graph (Grafana) clearly shows all the interruptions that took place during the test phase to write this post (and coffee breaks…)
Add an exporter
In this example, I will add the exporter “haproxy_exporter”. For this purpose I have a server equipped with the haproxy software and configured for Layer7 load balancing.
Connect root to your haproxy server, go to the /opt directory:
cd /opt
And download the archive “haproxy_exporter “ corresponding to your platform :
- Rasberry PI: Operating system: Linux - Architecture: armv7
- Rock64 : Operating system : Linux - Architecture : arm64
Use the command wget, example for the Raspberry PI-0.09 version :
wget https://github.com/prometheus/haproxy_exporter/releases/download/v0.9.0/haproxy_exporter-0.9.0.linux-armv7.tar.gz
Extract the data from the archive, example for the previous download:
tar xfz haproxy_exporter-0.9.0.linux-armv7.tar.gz
rm haproxy_exporter-0.9.0.linux-armv7.tar.gz
cd haproxy_exporter-0.9.0.linux-armv7/
To use this exporter you will need to enable haproxy statistics. Add to your /etc/haproxy/haproxy.cfg file, the following lines
frontend stats-haproxy
http mode
global log
maxconn 2
stats uri /
stats realm Haproxy\ Statistics
##stats auth xxxxxxx:xxxx
bind[IP address stats]:[port stats] ssl crt[certificate file name.pem]

# or without SSL support: bind[IP address stats]:[port stats]
enabled
For the purposes of this post I have disabled authentication of access to HAPROXY statistics
Reload haproxy:
systemctl reload haproxy
Run the export in detached mode and provide it with the parameters for accessing HAPROXY statistics:
nohup./haproxy_exporter --haproxy.scrape-uri=https://[IP address stats]:[port stats] /?stats;csv --no-haproxy.ssl-verify &
or without SSL support:
nohup./haproxy_exporter --haproxy.scrape-uri=http://[IP address stats]:[port stats] /?stats;csv &
The exporter is now working and listening on the port: TCP/9101
Let’s add the INPUT rules to the firewall of this server:
iptables -A INPUT -i eth0 -p tcp -m tcp --dport 9101 -j ACCEPT
iptables -A OUTPUT -o eth0 -p tcp -m tcp -m tcp --sport 9101 -m state --state RELATED,ESTABLISHED -j ACCEPT
To test the proper functioning of this service, use a browser with the url: http://[client server IP address]:9101/metrics
Prometheus server configuration
Go to the installation directory of the prometheus service. Add these lines to the prometheus.yml file
job_name: "haproxy
  static_configs:
   - targets: ['172.28.0.0.1:9101']
Adjust the bold values to your situation
Reload the Prometheus configuration (see above)
Go now to the Grafana server, as administrator and add the dashboard whose id is: 2428 (https://grafana.com/dashboards/2428)
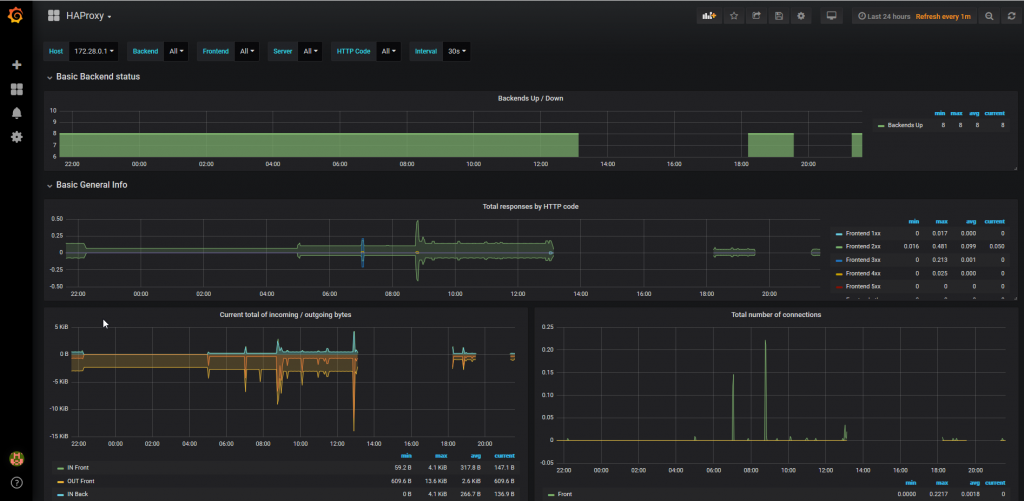
Generate some flow at the Haproxy loadbalancer and consult the Grafana dashboard:
Matrix/Synapse/Element.io integration
update of 25/04/2019
Please refer to these articles:
- Synapse Matrix Server Installation: /en/blog/matrix-synapse-installationserveur-clientelement/
- Integration with a Synapse Matrix server:/en/blog/matrix-synapse-installation-bot-goneb/
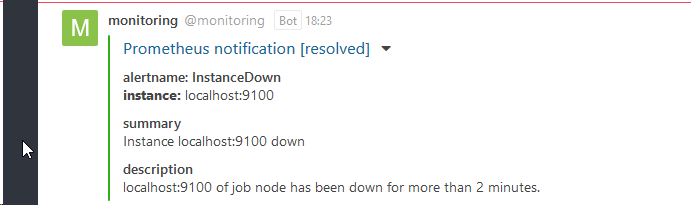
RocketChat integration
Follow the procedure: github.com/pavel-kazhavets/AlertmanagerRocketChat
class Script {
    process_incoming_request({
        request
    }) {
        //console.log(request.content);
        var alertColor = "warning";
        if (request.content.status ==== "resolved") {
            alertColor = "good";
        } else if (request.content.status ==== "firing") {
            alertColor = "danger";
        }
        let finFields = [];
        for (i = 0; i < request.content.alerts.length; i++) {
            var endVal = request.content.alerts[i];
            var elem = {
                title: "alertname:" + endVal.labels.alertname,
                value: "_instance:_" + endVal.labels.instance,
                shorts: false
            };
            finFields.push(elem);
            if (!!endVal.annotations.summary) {
                finFields.push({
                    title: "summary",
                    value: endVal.annotations.summary
                });
            }
            if (!!endVal.annotations.severity) {
                finFields.push({
                    title: "severity",
                    value: endVal.annotations.severity
                });
            }
            if (!!endVal.annotations.description) {
                finFields.push({
                    title: "description",
                    value: endVal.annotations.description.description
                });
            }
        }
        return {
            content: {
                username: "monitoring",
                attachments:[{ {
                    color: alertColor,
                    title_link: request.content.externalURL,
                    title: "Prometheus notification [" + request.content.status +"]",
                    fields: finFields
                }]
            }
        };
       return {
            error: {
                success: false
            }
        };
    }
}
I made some changes to indicate the alert status at the title level of the alert received on rocketchat and commented on the console.log instruction….
Going further
- Preparation of servers for the automatic execution of services at server startup: manufacturing of files for “systemd”.
- Filter the metrics found (service configuration files)
- Communication with an incident management tool (
victorops,opsgeni,trudesk,…) - Scalability, high availability,…
- Secure the whole thing: refine firewall rules, implement authentication at the Prometheus server level
- Attention, the Prometheus console expresses the dates in UTC. While Grafana is configurable, Prometheus is not (It is a developer’s choice).
Document licence : Creative Commons (CC BY-NC-ND 4.0)
THIS DOCUMENTATION IS PROVIDED "AS IS", WITHOUT WARRANTY OF ANY KIND AND DISTRIBUTED FOR EDUCATIONAL PURPOSES ONLY. THE AUTHOR, CONTRIBUTORS TO THIS DOCUMENTATION OR ©MYTINYDC.COM SHALL IN NO EVENT BE LIABLE FOR ANY DIRECT OR INDIRECT DAMAGE THAT MAY RESULT FROM THE APPLICATION OF THE PROCEDURES IMPLEMENTED IN THIS DOCUMENTATION, OR FROM THE INCORRECT INTERPRETATION OF THIS DOCUMENT.