
(**) Translated with www.DeepL.com/Translator
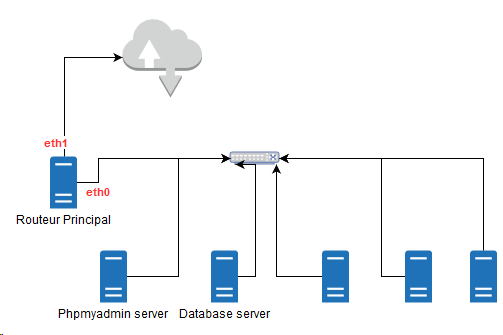
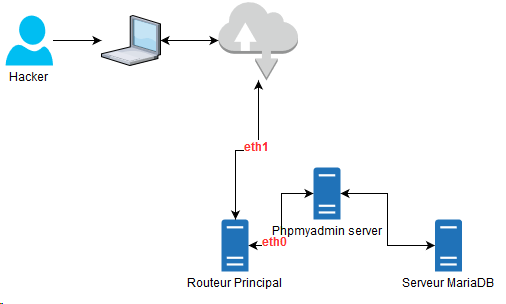
Network topology
Case description
- Operation performed on a MytinyDC Mini-Datacenter (Raspberry PI and Rock64).
- Data center internal network throughput: 100 Mbps, i. e. a theoretical maximum throughput of 12.5 Mb/s
- Type of monitoring: “Prometheus” - “Grafana” - “Prometheus Alert”.
- The attack is being carried out on the Datacenter network.
- Data leak caused by an export from the “ossec” database through the Phpmyadmin application (Phpmyadmin server). This documentation does not cover other types of leaks.
- The volume of the dump “Mariadb” is about 100 MB.
- The database is stored on the “Database server” server
- The initial detection rule (basic): takes the sliding average “rate()” of the output rate of the Ethernet card of the server “Database server”, estimation of a constant corresponds to the limit not to exceed, here** 2800 kb/s**.
- Creation of a generic alert rule specific to this case, for “Prometheus Alert” and independent of the monitoring data history.
- Find the data output destination using **Grafana **and the available monitoring data.
- Creation of a dashboard (Grafana), allowing repetition.
Step 1
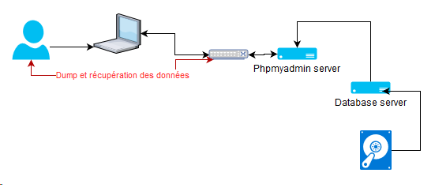
The provocative event will be the export of a “MariaDB” database (ossec in our case) via the application **phpmyadmin **which is located on the “Phpmyadmin server” server. The “MariaDB” service is hosted on the “Database server” server. The hacker will connect to **phpmyadmin **and use the “export” function of this application and retrieve the exported data file. The entire operation takes place through the Datacenter network.
Data extraction through the network
Reproducing this case is simple. The hacker had access to the **phpmyadmin ** application, and requested the export of a database. The available information:
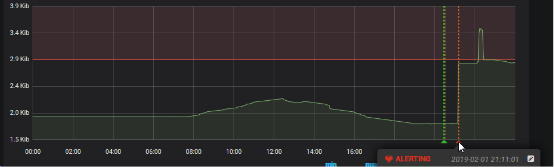
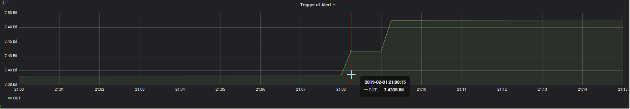
This graph shows us the time of the alert. This alert is defined by a very basic control of the average sliding rate ( “rate()” function), the Ethernet connection of the “Database server” server, the threshold at that time was 2800 kb/s. The alert is triggered at 21h11.
Let’s see side** Read I/O Disk** of this server, over the same period (Prometheus probe: node_disk_read_bytes_total)
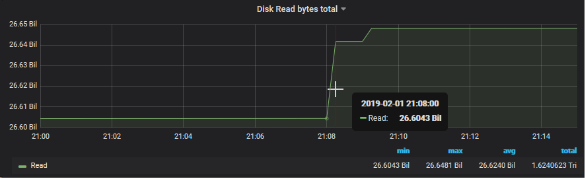
A sudden increase in the reading curve on the hard disk can be seen**_
On the** Write I/O Disk** side of this server, over the same period (
Prometheus probe : node_disk_written_written_bytes_total)
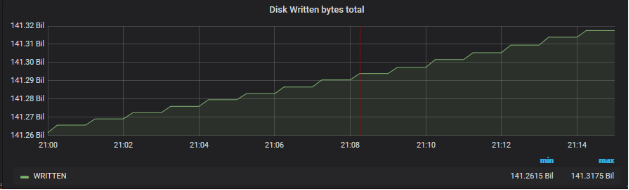
Nothing obvious, the dump is done by the network.
Network side :
If network packets have been sent from this server, they must have a destination (IN for the device that receives it). It can be a network machine, or an external machine, our Datacenter is connected to the Internet. **In case we don’t find a match, it could mean that the Hacker connected with a device directly to the Datacenter network.
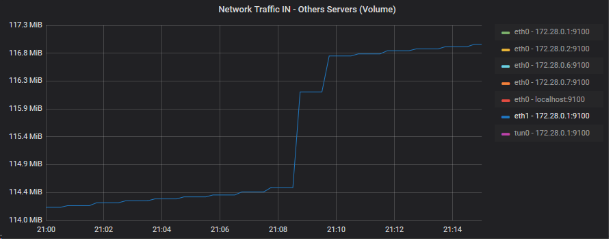
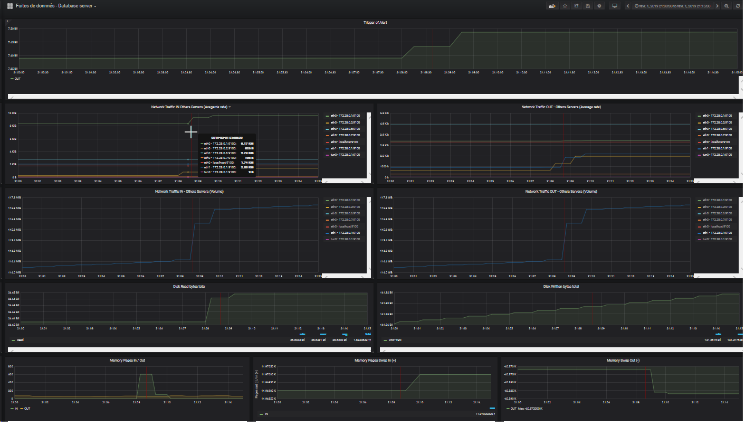
Network traffic analysis IN of network cards (full fleet)
This graph shows the average floating flow rate of input flows on the network cards in the fleet, excluding our “Database server” server. I use an average rate because the bit rates (graphic AB, lower), smoothed between the different Datacenter servers, do not show peaks (related to the scale smoothing performed by Grafana).
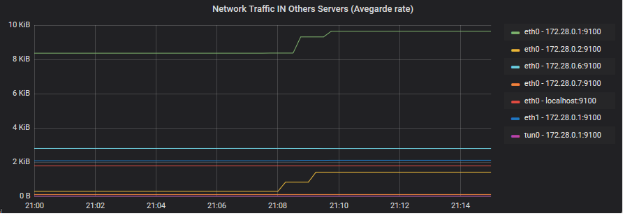
We can clearly see here a correspondence on the machines 172.28.0.1 and 172.28.0.2 (eth0 for both). The interfaces correspond to “devices” connected to the Datacenter network. 172.28.0.2 is our “Phpmyadmin server”, 172.28.0.1 is our “Main router” server. We also have a slight rise on eth1 of 172.28.0.1.
Zoom of the devices incriminated on the gross volume graph (graph AB)
eth0 - 172.28.0.0.1:9100
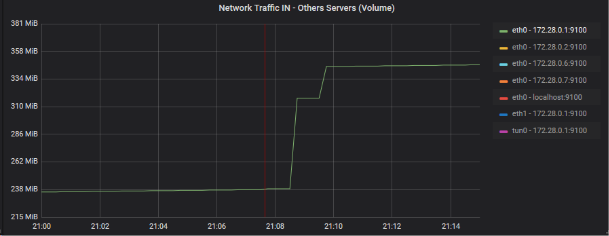
eth0 - 172.28.0.0.2:9100
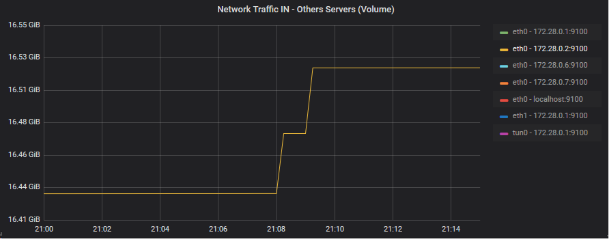
eth1 - 172.28.0.0.1:9100
So I will look at the OUT traffic of this last device, since it is the main router of the Datacenter:
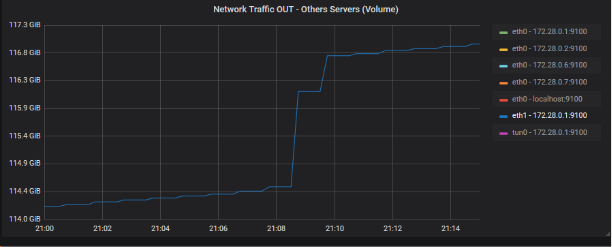
The output volume is large enough to correlate the latter with the leak volume (approx. 100 MB). Let’s summarize the possible scenario with a small drawing
We have now established the scenario of the attack, the first questions and answers:
| **Questions**** | **Responses** |
| How did the **hacker **find the exposure of the **phpmyadmin service**? | The haproxy service, installed on the router exposes the url: https://phpmyadmin.[domain name], check the security of the DNS which can offer the possibility of a complete dump of the main domain service database |
| How could the **hacker** connect to the **Main router**? | |
| What type of information does the hacker have? | Introspection of "apache2" logs. It is this service that provides Phpmyadmin (around 9pm) - see the following chapter |
| And who is the Hacker? | see next chapter |
Introspection log “apache2” on phpmyadmin server
Command used :
grep -E "01/Feb/2019:21.*phpmyadmin.*export" access.log
I get 4 lines:
| 172.28.0.1 - - -[01/Feb/2019:21:07:23:23 +0530] "GET /phpmyadmin/db_export.php?db=ossec&..... HTTP/1.1" 200 16013 "-" "Mozilla/5.0 (Windows NT 10.0; Win64; x64; rv:64.0) Gecko/20100101 Firefox/64.0" |
| 172.28.0.1 - - -[01/Feb/2019:21:07:25:25 +0530] "GET /phpmyadmin/js/get_scripts.js.php?scripts%5B%5D=export.js...... HTTP/1.1" 200 6070 "-" "Mozilla/5.0 (Windows NT 10.0; Win64; x64; rv:64.0) Gecko/20100101 Firefox/64.0" |
| 172.28.0.1 - - -[01/Feb/2019:21:12:40:40 +0530] "GET /phpmyadmin/export.php?ajax_request=true...1 HTTP/1.1" 200 2378 "-" "Mozilla/5.0 (Windows NT 10.0; Win64; x64; rv:64.0) Gecko/20100101 Firefox/64.0" |
| 172.28.0.1 - - -[01/Feb/2019:21:21:36:37 +0530] "GET /phpmyadmin/db_export.php?db=ossec..... HTTP/1.1" 200 4380 "-" "Mozilla/5.0 (Windows NT 10.0; Win64; x64; rv:64.0) Gecko/20100101 Firefox/64.0" |
We can already notice a first problem: the IP address of the requester is that of the Main Router, where the “haproxy” service is located. The apache server is not well configured, it should show the real address of the requester and save us time during this introspection.
The standard format of log apache2 is:
LogFormat "%h %l %u %u %t \"%r\" %>s %b \"%{Referer}i\" \"%{User-Agent}i\" combined
which should be replaced by:
LogFormat "%{X-Forwarded-For}i %l %u %t \"%r\" %>s %b \"%{Referer}i\" \"%{User-Agent}i\" combined
The “X-Forwarded-For” field is sent by haproxy.
Now let’s detect the databases recovered by the Hacker: we can see in the first line:
db_export.php?db=ossec....
Let’s change the regular expression of our system command:
grep -E "01/Feb/2019:21.*phpmyadmin.*export.*db=" access.log
At this point we can already say that the hacker has intercepted only one database whose name is “ossec”. The security manager will have to evaluate the relevance of the data intercepted by the hacker. We can already say that it has the whole infrastructure scheme with login, without password, etc…. The apache2 logs do not give us the login of the hacker, but we can see that he connected directly, so he knew the password.
Introspection of the haproxy log
The domain name is phpmyadmin.[xxx]
System control:
grep -E "Feb 1 21:07.*phpmyadmin.*export.*db=" /var/log/haproxy.log
I find the traces and urls corresponding to those of phpmyadmin well except that I have in these traces, the original IP address and port (192.168.1.1.3:62123) used by the Hacker:
Feb 1 21:07:25 xxxx haproxy[20906]: **192.168.168.1.3:62123**[01/Feb/2019:21:07:23.7 95] 192.168.1.115:80http phpmyadmin.xxxxxxx /xxxxx 0/0/0/1466/1474/1474 200 16013 - - --- - 7/3/0/1/0 0/0 "GET /phpmyadmin/db_export.php?db=ossec... 3835 HTTP/1.1" HTTP
Let’s try to find the volume of the leak using haproxy logs?
System control:
grep -E "Feb 1 21:.*phpmyadmin.*POST.*export" /var/log/haproxy.log
Feb 1 21:08:49 xxxxxxx haproxy[20906]: 192.168.1.3:62123[01/Feb/2019:21:07:38.437] 192.168.1.115:80http phpmyadmin.xxxx /xxxxx 0/0/1/512/70932 200 **106063666 **- ---- 6/3/0/1/0 0/0 "POST /phpmyadmin/export.php HTTP/1.
The data leakage concerns: 106063666 bits is more than 100MB of data!!!!
Infrastructure improvement to be proposed
This is a very simple case, with a detectable peak of activity on my infrastructure (100mo):
- We have to find a mathematical formula that allows the automation of detection and not through a pre-analysis of traffic and a limit by means of a constant as I have used it here. On a day and depending on the organization, there will inevitably be peaks, which will be false positives, you will also have to manage weekends, holidays, etc… or the activity is limited, with the use of this method, some periods or the delta will be very large will allow more easily the data theft. To observe the peaks of a predefined quantity (100mo for example) I chose to calculate the output network volume in relation to the last point measured by the monitoring and the volume of the last two minutes. The theoretical throughput of my network is 100 Mbps or 12.5 Mbps. I will reasonably take 80% of this value or 10 MB/sec. In one minute, my network can “evaporate” 600MB. If the download start starts 1 second before the monitoring scrapbook, I will only have 10MB of leakage on the last reading, but on the next one, I will have my 590MB.
- The delta between detection and alert therefore brings me to 2 minutes for scraps, + 1 minute latency regarding the “Prometheus Alert” alert, which makes us 3 minutes. In 3 full minutes with the speed of my network, the Hacker can steal 1.8 GB of data which is quite significant. The possible solution is therefore to increase the frequency of Prometheus scraps. This will have an impact on performance…. On the other hand, is it likely that the team will act immediately by cutting the service and during the continuation of the download? of course not. Unless you have 24-hour concentrated staff with an emergency stop button available for each of the services available in the Datacenter.
- Build a “Grafana” dashboard specific to this type of attack.
Conclusion
To carry out this case study, it is necessary to have efficient monitoring tools, with well adjusted scrapbooking periods.
I like the Prometheus service very much, very easy to install on the one hand, it works perfectly even on Raspberry PI units.
The Grafana analysis tool is an excellent tool and of primary importance in this study. It is precise and has an unprecedented function: add graphs to a dashboard and its parameters: “Panel Option” - “Graph Tooltip” - select “Shared CrossHair” - Save. Move on a graph, a red vertical line is positioned on all the graphs of the dashboard for the same period. Therefore, if you position your mouse cursor on the peak of a graph, this function immediately highlights the peaks observed on the other graphs.
It is clear that this type of attack requires immediate detection and countermeasure, even if it is obvious that this type of process must be put in place. If you have not been able to prevent the leak, you can act very quickly by changing the Datacenter settings so that this does not happen again.
To secure a network against this type of data leakage, it is necessary (non-exhaustive list):
- We have just seen it, we have adapted tools
- be aware of the volume that can “evaporate” in only 3 minutes
- be prepared to quickly assess the extent of the leak
- have accurate documentation of your infrastructure
- have a procedure allowing system administrators to operate as quickly as possible (login/password || ssh key to allow log analysis, etc…..)
- have PLCs that allow immediate disconnection of services.
- correctly configure the services available on the network (apache2 in my case)
- find a centralized log solution for all servers. This avoids the need for system administrators to connect to the various servers, which is a challenge, to analyze the logs. A centralized environment makes it possible to go much faster.
- For an infrastructure hosting critical data, it will probably be necessary to install artificial intelligence, capable of analyzing in real time, the different cases of your organization.
- Allow a tracking of connections to the database servers (login date/time).
- Review the infrastructure access policy (firewall rule, delegation of rights, password management policy, etc.)
- Be also aware of the considerable work required to implement a data leak monitoring plan.
Document licence : Creative Commons (CC BY-NC-ND 4.0)
THIS DOCUMENTATION IS PROVIDED "AS IS", WITHOUT WARRANTY OF ANY KIND AND DISTRIBUTED FOR EDUCATIONAL PURPOSES ONLY. THE AUTHOR, CONTRIBUTORS TO THIS DOCUMENTATION OR ©MYTINYDC.COM SHALL IN NO EVENT BE LIABLE FOR ANY DIRECT OR INDIRECT DAMAGE THAT MAY RESULT FROM THE APPLICATION OF THE PROCEDURES IMPLEMENTED IN THIS DOCUMENTATION, OR FROM THE INCORRECT INTERPRETATION OF THIS DOCUMENT.