
(**) Translated with www.DeepL.com/Translator
Update 11/24/2022: Be careful before upgrading from Fluent-bit v1.9 to Fluent-bit v2.0 (view this post)
This operation will consist in setting up the servers of the Datacenter, so that they send their “rsyslog” traces to an ElasticSearch service.
Source documentation :
Prerequisites
- A working ElasticSearch/Kibana solution
- The domain name and network port to access the elasticSearch service, e.g. els.mondomain.com:443
- A user account and password to allow “Fluent-bit” to inject its data into the ElasticSearch application.
ElasticSearch configuration
- From the Kibana interface, connect with the administration account (“elastic”).
- Create the role: “servers_rsyslog”, indicate the index “fluent-bit” and give it the privileges “write” and “create_index”.
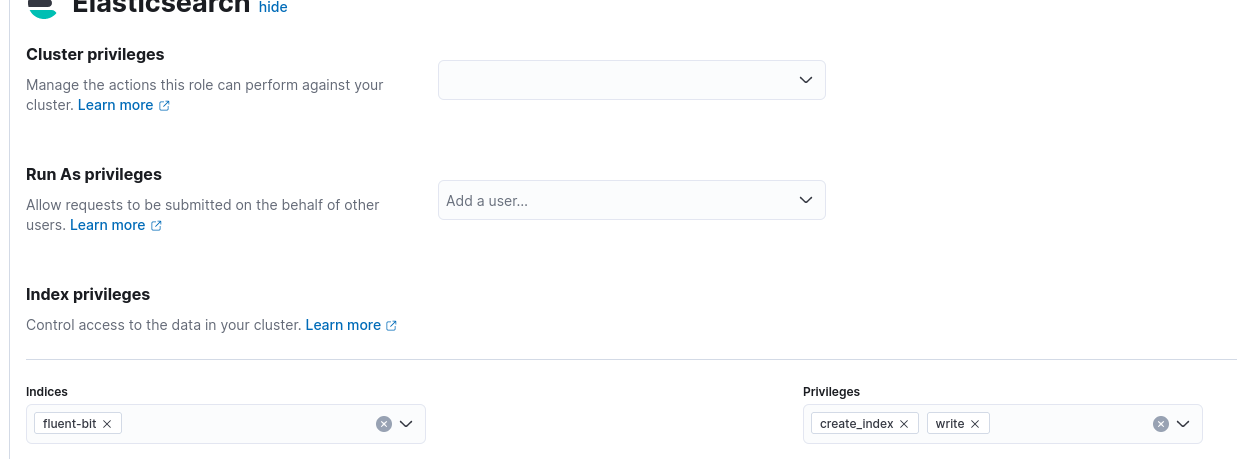
- Create the “servers_rsyslog” account to be used by the Datacenter servers, and assign it the “servers_rsyslog” role
PS : keep the new login and password (necessary to configure “Fluent-bit” on the servers).

Datacenter Servers - Installation of “Fluent-bit
This operation is to be performed on all servers of the Datacenter:
Warning: does not work on armhf architectures - Source
-
Connect to the server as root
-
Create the file “/etc/apt/sources.list.d/fluenbit.list
deb [signed-by=/usr/share/keyrings/fluentbit-keyring.gpg] https://packages.fluentbit.io/debian/bullseye bullseye main
- Download the GPG key:
curl https://packages.fluentbit.io/fluentbit.key | gpg --dearmor > /usr/share/keyrings/fluentbit-keyring.gpg
- Installer :
apt update
apt -y install fluent-bit
# Start at boot
systemctl enable fluent-bit
Datacenter Servers - Configure “Fluent-bit
These operations are to be performed on all servers of the Datacenter:
Global configuration
The configuration of “Fluent-bit” can be found in the file : "/etc/fluent-bit/fluent-bit.conf “, open this file then :
- Delete these lines :
[INPUT]
    name cpu
    tag  cpu.local

    # Read interval (sec) Default: 1
    interval_sec 1

[OUTPUT]
    name  stdout
    match *
- and Add :
[INPUT]
    Name     syslog
    Parser   syslog-rfc5424
    Listen   0.0.0.0
    Port     5140
    Mode     tcp

# see documentation https://docs.fluentbit.io/manual/pipeline/outputs/elasticsearch
[OUTPUT]
  Name  es
  # if ElasticSearch Service listens on tls port
  tls   On
  Match *
  HTTP_User [utilisateur elastic]
  HTTP_Passwd [Mot de passe utilisateur elastic]
  Host  [domaine du service elasticsearch]
  Port  443
  #https://stackoverflow.com/questions/71902938/fluent-bit-giving-400-with-elastic-search-contains-an-unknown-parameter-type
  Suppress_Type_Name On
  retry_limit false
Retry_limit allows the “Fluent-bit” service to retain the “rsyslog” trace as long as the recording in ElasticSearch has not worked. Retention is managed in memory (RAM) by default, there is a parameter allowing retention on files…
Configure the “Fluent-bit” parser
-
Open the file "/etc/fluent-bit/parsers.conf “
-
Look for the section :
[PARSER]
	Name syslog-rfc3164-local"
- Replace the expressions RegExp and Time_Format with :
    Regex       ^(?<time>[^ ]*+) (?<host>[^ ]*) (?<ident>[a-zA-Z0-9_\/\.\-]*)(?:\[(?<pid>[0-9]+)\])?(?:[^\:]*\:)? *(?<message>.*)$
    Time_Format %Y-%m-%dT%H:%M:%S.%L%z
This will allow to parse the “rsyslog” messages with a timestamp with the Timezone.
PS : Tools to debug the regexp : a Ruby regular expression editor : Rubular
Configure the “rsyslog” timezone for “Fluent-bit
By default the system traces do not show the timezone, the current format of a trace is :
Sep 1 10:45:46 rxxxx-159 systemd[1]: Started Time & Date Service.
Here, the timestamp logged (Sep 1 10:45:46) and provided by “rsyslog” does not include a timezone. ElasticSearch assigns timestamps in UTC and takes into account its “Timezone” parameter for presentation. Once this type of data is injected, you will be confronted with a 2h00 offset problem.
This image illustrates the problem:
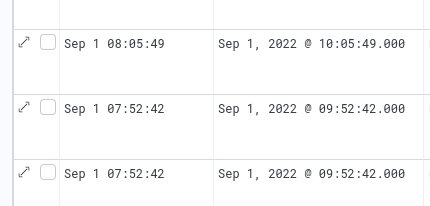 We have a system trace logged on “Sept 1st at 08:05:49” and ElasticSearch gives a timestamp at UTC+0200 (Europe/Paris)…
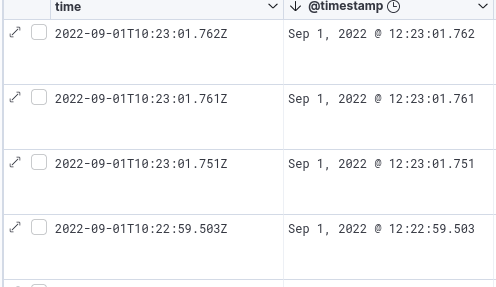
The expected result is this:
Configuring the “rsyslog” service
- Create the file "/etc/rsyslog.d/60-fluent-bit.conf” :
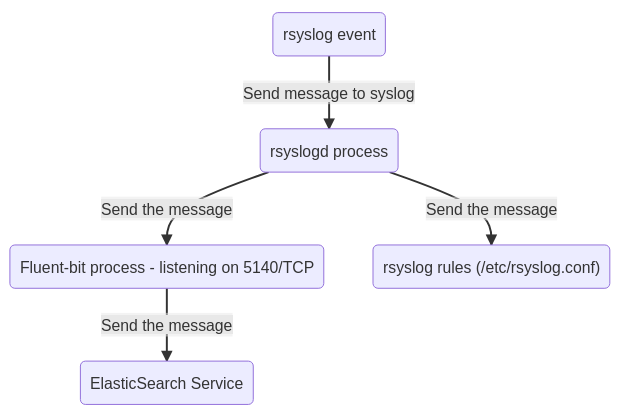
action(type="omfwd" template="RSYSLOG_FileFormat" Target="127.0.0.1" Port="5140" Protocol="tcp")
All events intercepted by “rsyslog” will be transferred to the 5140/TCP network service of “Fluent-bit” and not only the content of “/var/log/syslog “. The service “rsyslog” should not be confused with the file /var/log/syslog. The file “/var/log/syslog” is completed by the service “rsyslog”, depending on the rules defined by the administrator. Therefore, do not expect to find in elasticsearch only the items contained in “/var/log/syslog”. You will have all events received by the service through “rsyslog”.
Restarting services
- Restart the service “Fluent-bit” :
systemctl restart fluent-bit - Restart the service “rsyslog” :
systemctl restart rsyslog
“Dispatch” of a system message by “rsyslog
Errors rsyslogd
Once started, “rsyslog” connects to the fluent-bit service. If “fluent-bit” is not started you will find the following error in the “/var/log/syslog” file:
rsyslogd: cannot connect to 127.0.0.1:5140: Connection refused